
Rates Are Up, but Lenders Are Competing Harder For Your Loan
When Slatt Capital runs a financing process, we record every quote received. These quotes can be soft quotes, typically verbal, showing indicative pricing, or written quotes showing a lender’s pricing and terms. Most assignments we take on are either small-balance ($1-$10M) or middle-market ($10-75M) financing requests.
As such, we talk to dozens of lenders every day to understand their lending box, their current appetite for deals (are they busy or slow), and, most importantly, to build trusted relationships where we can serve as a filter and send them opportunities to compete on. Over the decades, we’ve learned that selectively targeting specific lenders with a loan assignment delivers better outcomes for our sponsor than running a wide auction that sends deals to dozens of lenders at once.
In a typical year, we review hundreds of loan opportunities a month and close 300+ loan transactions totaling $1.5B, making us one of the largest originators of small-balance and middle-market financing nationwide. This activity generates, on average, 300 new quotes per month and 5 quotes per deal, highlighting our ability to target the right lenders to compete on a deal-by-deal basis.
Additionally, Slatt Capital has one of the broadest platforms of life insurance company lenders, which typically source deals only through correspondents in the sub-$20M space. As such, our loan quote database represents a great benchmark for the three most important balance sheet lenders in the small-balance CRE space (banks, credit unions, and life insurance companies). Our CRE Permanent Debt Market Snapshot puts that data to work. It draws on hundreds of fixed-rate loan quotes from dozens of lenders in Q3 2026, plus our records back to 2019, to show what lenders are charging across six property types: multifamily, industrial, office, hospitality, single-tenant retail, and multi-tenant retail.
Why does that matter? Most national indices track the large upper-middle market and institutional market, with loans over $25M. New York tends to dominate these statistics as it is the largest institutional market in the country and the second-largest in CRE loan volume behind California. Ours reflect the broader universe where most transactions occur: small-balance and middle-market transactions, mainly in the Western U.S., from banks, life companies, credit unions, and debt funds. Because each quote comes from a live deal rather than a survey, the report shows the terms, rates, and spreads lenders were actually willing to transact on.
Five things to know
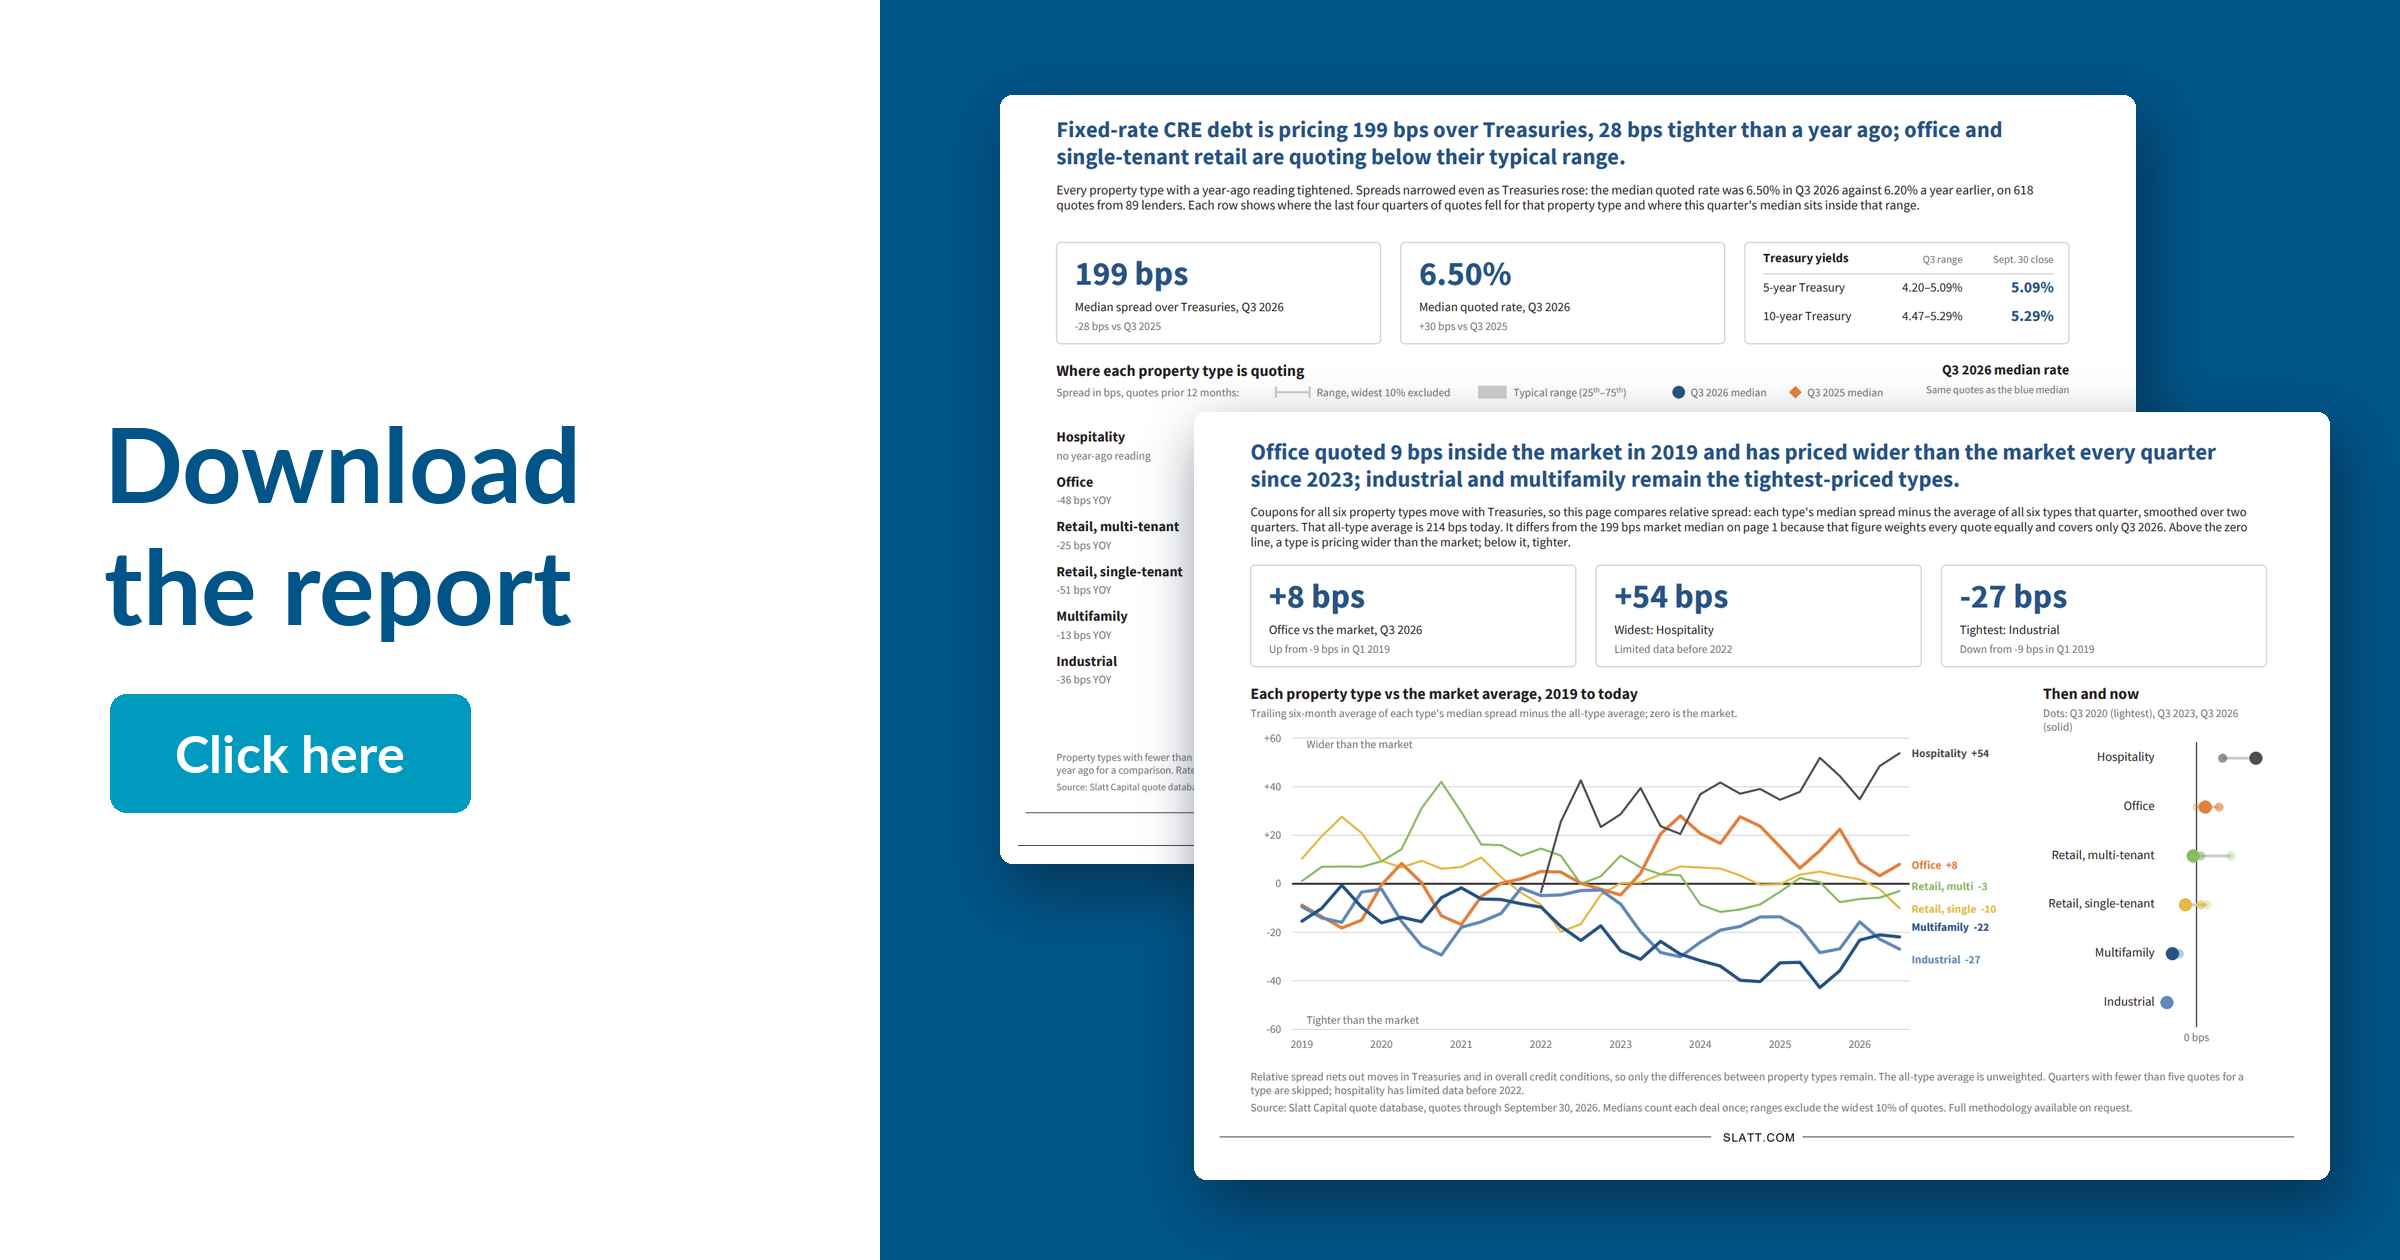
The number to watch is the spread: the extra interest a lender charges above the U.S. Treasury rate. Treasury rates move with the broader economy; the spread shows how lenders price risk on a particular loan above this benchmark. When median spreads are tightening, it generally means lenders are competing harder for loans in that asset class. Other interesting findings include the following five insights:
- Lenders are competing harder, even though rates are higher. The median spread was 199 basis points, 28 bps tighter than a year ago, and every property type tightened vs. a year ago. But Treasury rates climbed, so the typical quoted rate still rose, from 6.20% to 6.50%. Lender appetite is stronger than the headline rate suggests.
- Office and single-tenant retail made the biggest comebacks. Office spreads fell 48 bps and single-tenant retail 51 bps from a year ago. Both are now quoting at or below the low end of their typical range over the past year.
- Industrial and Multifamily are still lenders’ favorites, but the gap is closing. Industrial (184 bps) and Multifamily (187 bps) remain the tightest-priced property types. A year ago, Multifamily priced about 43 bps below the market average; today it is about 22 bps below, as other property types have caught up.
- Hospitality remains the toughest property type to finance. At 265 bps and a 7.04% median rate, hospitality sits about 54 bps above the market average.
- Seven years of data show how far office has traveled. In 2019, office priced about 9 bps below the market average. It has priced above the market every quarter since spring 2023, peaking near 28 bps over at the end of that year. Today the premium is 8 bps. A shift like that reflects a market that has been through a pandemic, a rate shock, and a recovery, which is exactly what this report draws on.
How to use this report
- Borrowers: Use the shaded “typical range” as a reality check. A quote inside it is in line with the market; one above it is worth a question. As always, your own rate will still depend on loan size, leverage, term, and sponsorship.
- Sponsors: Use the long-term view to see which property types lenders favor and how that is shifting. The relative-spread chart shows how lenders view each asset class over a full cycle, not just this quarter. That’s useful context for underwriting exit assumptions.
- Lenders: See where your pricing sits against the market for each property type, and where competitors are leaning in or pulling back.
- Broker advisors: Give clients realistic financing assumptions for underwriting and offers, and a clear explanation of why one property type finances differently from another.
A snapshot like this is only as good as the deal flow behind it. Having dozens of lenders quote our clients’ loans in a single quarter reflects the lender relationships Slatt has built since 1971, and running a competitive process on every deal lets us see where the market really is.
For pricing on a specific deal, talk to your Slatt Capital advisor: Request a Quote