When Will CRE Pricing Adjust to Higher Interest Rates?
This age-old question is fervently being debated across the CRE world, from brokers demanding record low cap rates, to sellers extending their own escrows to buy more 1031 identification time, to sponsors with ever-lower LTVs with maturing loans facing an uptick of refinance rates.
According to Real Capital Analytics (RCA), year-over-year prices through February 2022 across commercial real estate asset types have increased a record average of over 19.4% per the US National All-Property Index, with apartments and industrial leading the way and CBD office lagging far behind at just 4.7% annual growth. None of that is surprising to anyone with a pulse, though a problem with this data as presented is only reflecting deals through February, prior to the most dramatic uptick in rates of the last few weeks. Now that, by most accounts, we’re in solid reversion territory, with the Federal reserve promising more increases to their base rate, where do property values go?
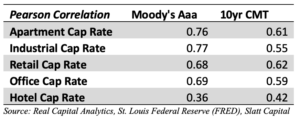
We did a brief technical analysis of cap rates across all major asset types in major markets and tried to discover whether a correlation exists between valuation and two traditionally compared measures for many investors: corporate bonds, and US Treasuries. Specifically, we compared the last 20 years of data for asset-level cap rates from RCA’s Trend Tracker with both the Moody’s Aaa Corporate Bond Yield and the 10-Year Constant Maturity from the St. Louis Fed’s data vault. The Pearson Correlation findings are below, with a resulting p number greater than 0.50 showing a strong correlation between cap rates and the bonds:

Turns out, they are strongly correlated (except for Hotels) over the last 20 years. That must be right, we immediately think, that we in commercial real estate who rely on robust valuations for investment decisions must certainly be done-for, right? Well, turns out the story may be more nuanced than at first glance.
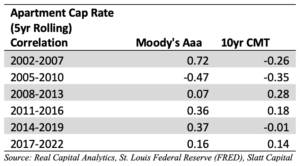
If we run the same analysis on a rolling 5-year basis (a time period that is in some ways more meaningful for real estate investors using debt) the correlation is a lot less clear:

We’ve chosen to illustrate this with apartments, but similar patterns emerge when analyzing all the major asset classes. Some periods here show even a weak negative correlation between cap rate movements and bond yields, which means at least during that 5 year period an increase in interest rates corresponded (loosely) with an increase in property values.
This lack of correlation seems surprising at first glance, at least until you start to consider the myriad of ways commercial real estate assets are priced in an efficient market. Supply and demand are key factors, as new supply in the construction pipeline could be delivered despite changes in the capital markets, or developers may opt to delay new construction starts altogether. On the demand side, inflation concerns can drive the opportunity cost of not investing to be so painful that some investors will pay nearly anything to avoid an erosion of their money. In most cases, too, there is a time gap between any perceived or actual erosion of buying power from a new buyer and the actual experienced erosion of a seller buying their 1031 replacement property maybe 3-6 months thereafter, causing valuation changes across asset classes to happen more slowly. Likewise, MAI appraisers don’t usually adjust valuations on a dime to real-time market pressures.
So, what results might we see from higher interest rates if a direct correlation to valuation is less clear? Investors will tend to (or will be forced to) borrow less (lower LTVs, more all-cash investments, less diversity in portfolio exchanges, etc), some investors will decide they must hold an asset longer or take longer-term fixed-rate loans, sellers may opt to pull their listings off the market (causing supply to further shrink), or investors may continue to shift to other submarkets or other asset classes seeking whatever yield is still out there.
Colloquially, we’re seeing many market participants, buyers and sellers alike be a tad more gun-shy about jumping all-in on their new transaction. We’re seeing transactions stretching longer, more replacement properties being evaluated earlier than the official ID time, and we’re even hearing all-cash transactions stretch beyond the typical 45-day close (though we’re admittedly and by definition seldom involved in those). Clients that 30 days ago were looking for floating rate or shorter-term fixed structures are now asking for the warm comfort of fixed rates beyond 10 years in an exceedingly flat or inverted yield-curve market. Rate locks are more crucial to all transactions with debt, and forward rate locks for maturing loans are en vogue. Above all, we’re hearing from all market participants an extreme hunger for information on what’s happening out there, though conflicting data points certainly abound.
For those of us who pay attention to such things, prognosticators of all types wonder when commercial asset valuations may ever see its shadow. We’re no exception here. But based on some technical analysis, our industry’s shared methods of prediction may hold just as much value as those of a certain Pennsylvania rodent.
Cody Charfauros
Principal / Managing Director
D: 858.257.2110
codyc@slatt.com